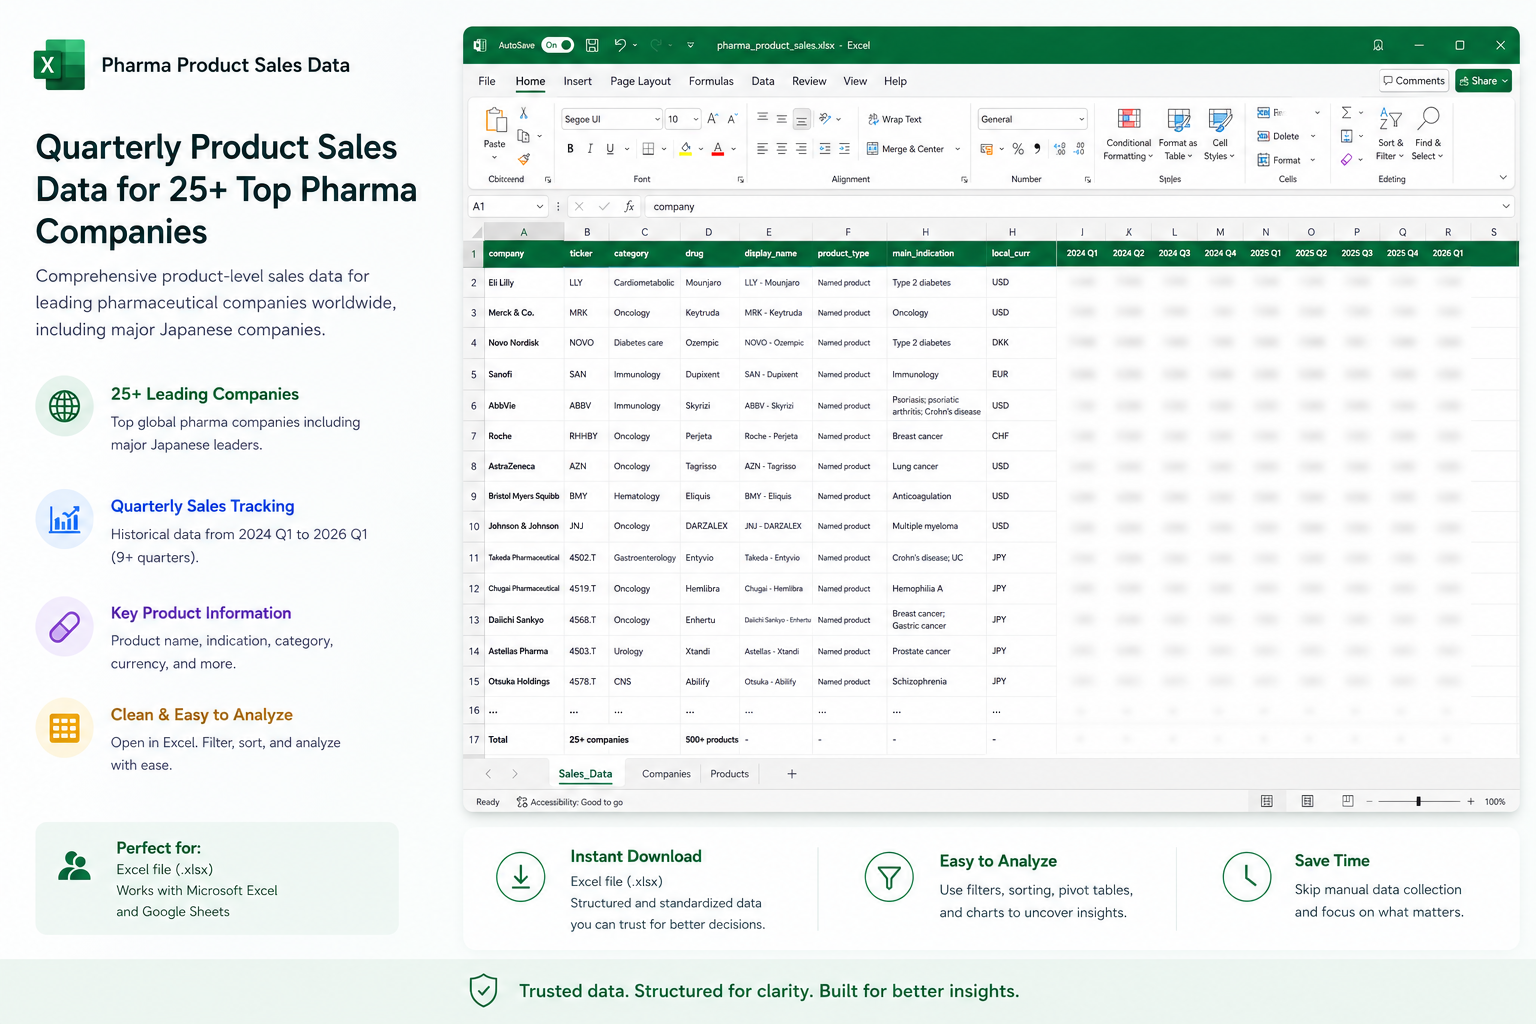
Clean product-level table
Quarterly product sales with standardized product names, company, ticker, indication, therapeutic area, reported category, currency, and quarter columns.
Quarterly pharmaceutical product sales database
Quarterly pharmaceutical product sales from the world's leading pharma companies, standardized into a single database with an offline interactive dashboard.
Current edition includes Excel/CSV source data plus an offline interactive HTML dashboard.
Pharma product sales database
DrugSalesDB is a lightweight alternative for investors and analysts who need quarterly drug sales, launch tracking, and cross-company pharma revenue comparison without manually rebuilding tables from PDFs and investor appendices.
Designed for
Instead of collecting product sales from dozens of investor presentations, annual reports, earnings releases, and SEC filings, DrugSalesDB brings everything together in a consistent format for analysis.
What you get
The product is the workbook. The chart is there to make the data easier to feel, share, and inspect before you start filtering.
Quarterly product sales with standardized product names, company, ticker, indication, therapeutic area, reported category, currency, and quarter columns.
Use the workbook directly in Excel, Google Sheets, filters, pivot tables, charts, or your own analysis workflow.
Directional USD conversions make cross-company ranking easier, while local-currency fields preserve company-reported context where it matters.
An offline HTML dashboard lets you search, filter, and compare product-sales momentum across companies and normalized therapeutic areas.
The current edition tracks quarters from 2024 Q2 through 2026 Q1 where company disclosures make the data available.
Company-reported categories are kept, while normalized therapeutic areas make cross-company comparisons easier.
Companies included
The current build includes 27 companies, including major US, European, and Japanese pharmaceutical companies.
Included HTML dashboard
The screenshots below show the interactive HTML companion included with the product. It works offline and lets you search, filter by company or therapeutic area, and compare drug sales across the full paid dataset.
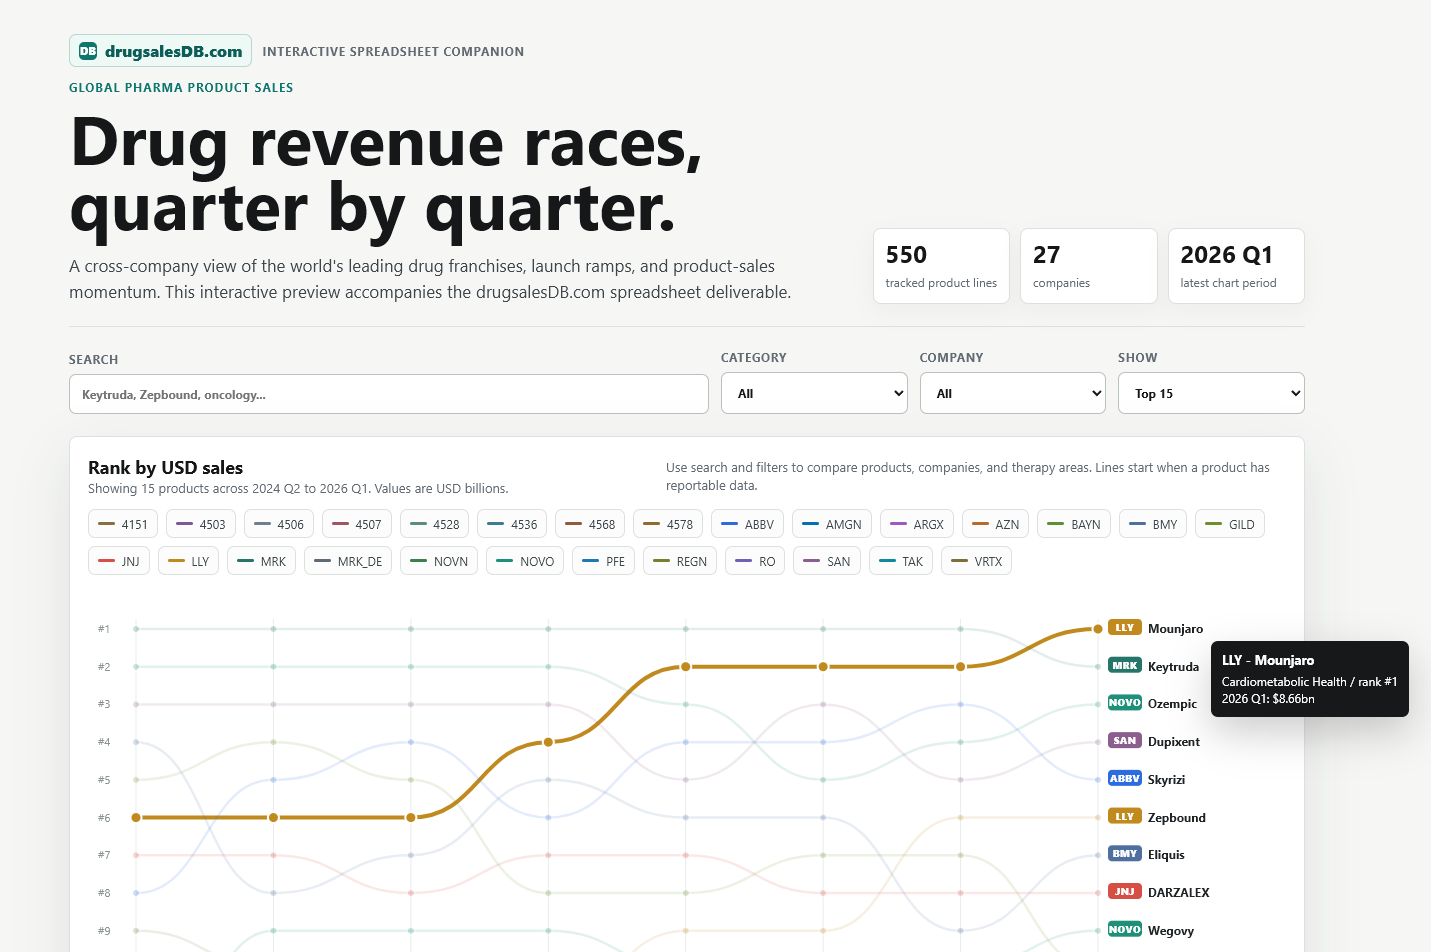
The included dashboard ranks products by quarterly USD sales and helps you compare franchises across companies and therapeutic areas.
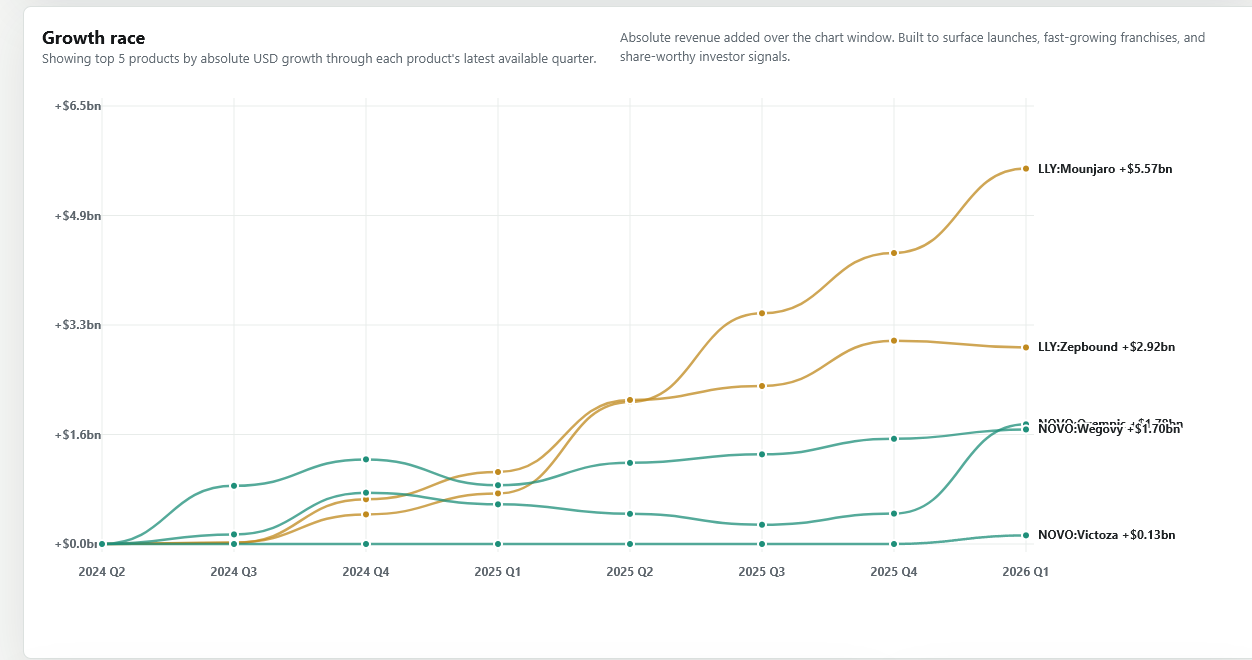
The companion view makes launch ramps and product movement easier to spot before you dive into the Excel/CSV source data.
Sample download
The sample is intentionally small: six non-GLP rows with the full quarter structure from 2024 Q2 to 2026 Q1. It shows the schema without replacing the paid workbook.
| Company | Product | Area | 2024 Q2 | 2026 Q1 |
|---|---|---|---|---|
| Merck & Co. | Keytruda | Oncology | 7.27 | 7.91 |
| Johnson & Johnson | DARZALEX | Oncology | 2.88 | 3.96 |
| AbbVie | Skyrizi | Immunology | 3.21 | |
| Bristol Myers Squibb | Eliquis | Hematology | 3.42 | 4.14 |
Built for screening
Whether you're comparing blockbuster drugs, tracking commercial launches, preparing investment research, or following quarterly earnings, the value is cleanup, normalization, and faster comparison.
Spotting launch ramps, comparing leading drug franchises, screening therapeutic areas, and saving time otherwise spent pulling numbers from filings, PDFs, and investor appendices.
Company-reported product sales can vary by disclosure style. USD conversions are directional. This is research data, not investment advice or audited financial reporting.
FAQ
An Excel workbook plus an interactive HTML preview. The workbook is the core deliverable.
The goal is to update after major quarterly reporting cycles, with priority on the companies and products investors care about most.
It is built from company-reported product sales and cleaned for analysis. Because companies report differently, some judgment and normalization are involved.
No. It is a structured research dataset for screening and analysis.
You can. The point is saving the collection and cleanup time across earnings workbooks, presentations, PDFs, SEC filings, currencies, and reporting conventions.
Yes. Email hello [at] drugsalesdb [dot] com for requests, corrections, or data questions.
Track top drug franchises, launches, and product-sales momentum across major pharma companies in one clean workbook.